Data Viz Dos and Don’ts
 5 mins. 5 mins.
By Elisabeth Wilson, Senior Impact Analyst
Science is a creative process told through data visualization. Researchers spend hours and hours studying the world around us. Visualizing our findings allows more people to understand our work and, most importantly, to act on it.
But what you may not know is that making a good, clear data visualization takes experimentation and a lot of trial and error.
When the MFF team published the final 2021 Disruption Report, it featured 19 figures made using RStudio. Those 19 final visualizations were the best out of a total of 44 we created. Along the way, we learned many lessons, and we learned some new techniques for making the best possible data visualizations to tell our story of disruption.
Learn from our mistakes with a few dos and don’ts to help improve your data process and tell your story.
Every year, MFF gives to transformational organizations across the country. But listing the gifts in a table format wouldn’t be easy to read; nor would it help our readers fully “see” in which states we were making our gifts. . So we tried a few options.
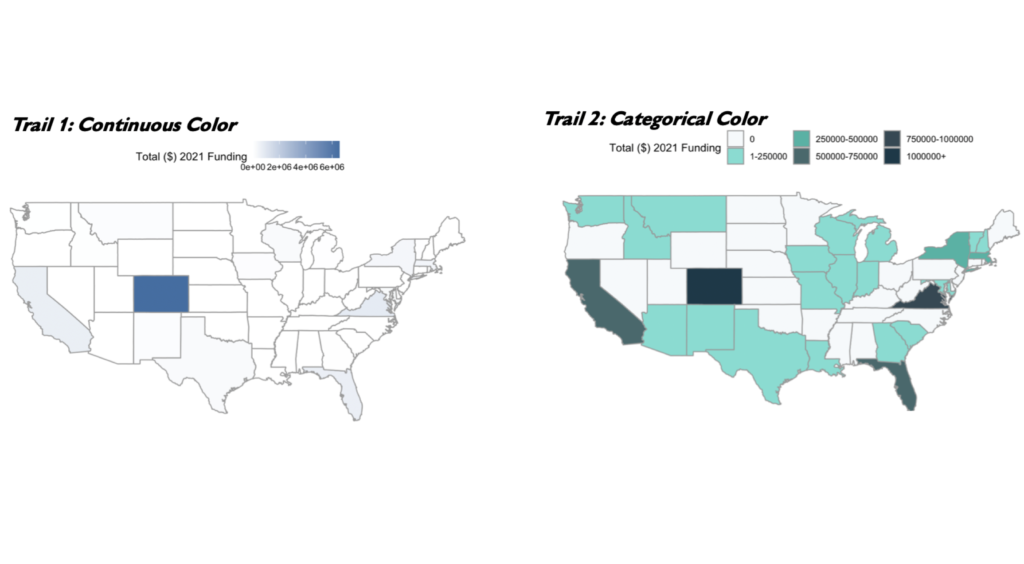
Our first attempt was to… start by mapping the total amount MFF gave in each US state and used continuous color to represent the total grant amount (Trial 1, pictured below.) In 2021, MFF provided funding to organizations across 25 states, in amounts ranging from $0-$6 million dollars which were represented with colors from white to dark blue. But, as you can see, the giving range was so large most states barely received any color (Trial 1). Back to the drawing board.
When continuous color didn’t work, we moved on to the next option: categorical color. Categorical color is grouping the colors into categories to decrease the range in your data. To figure out which groups to use, you look at the distribution of your data. Our distribution gave us six categories and that gave us Trial 2. The color looked gorgeous, but the integrity of the data was compromised. We asked, “Does this figure tell a clear story when a state that received $5,000 is the same color as a state that received $250,000?” We decided it did not and went back to the drawing board.
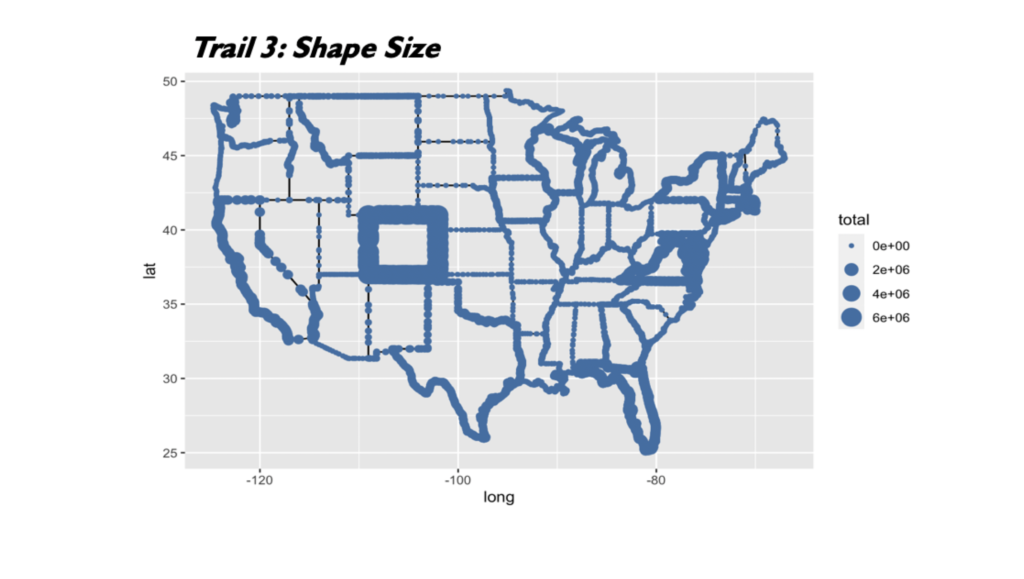
Since color failed us in representing how much we gave per state in 2021, size of the state’s border was the next option. Trial 3 didn’t work either. The range in giving was again so large our highest funded state, Colorado, completely obscured the giving everywhere else.
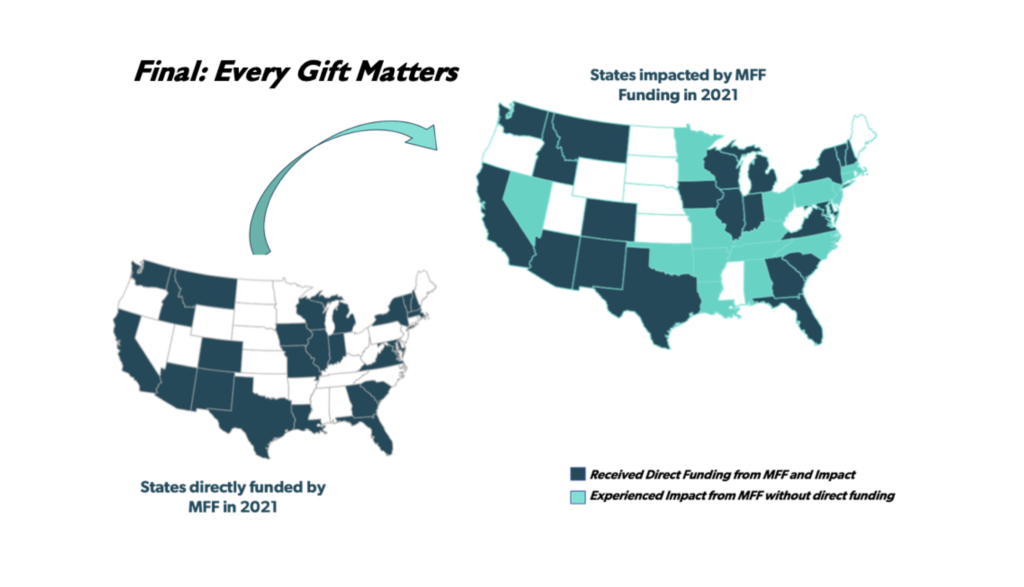
We were stumped. How were we going to display giving per state? That is when it hit us. Our original question wasn’t how much do we give per state, but where we give. The goal of this visual was to see our impact across the country and, as we always say at MFF, “Every gift matters.”
We instead used three categories, direct funding, indirect impact and no funding. Many of our partner nonprofit organizations receive money in one state but deploy the funds nationwide, creating the third category. Trials 1-3 hid the story we wanted to tell, which was where we impacted in 2021 and where we might need to focus in 2022.
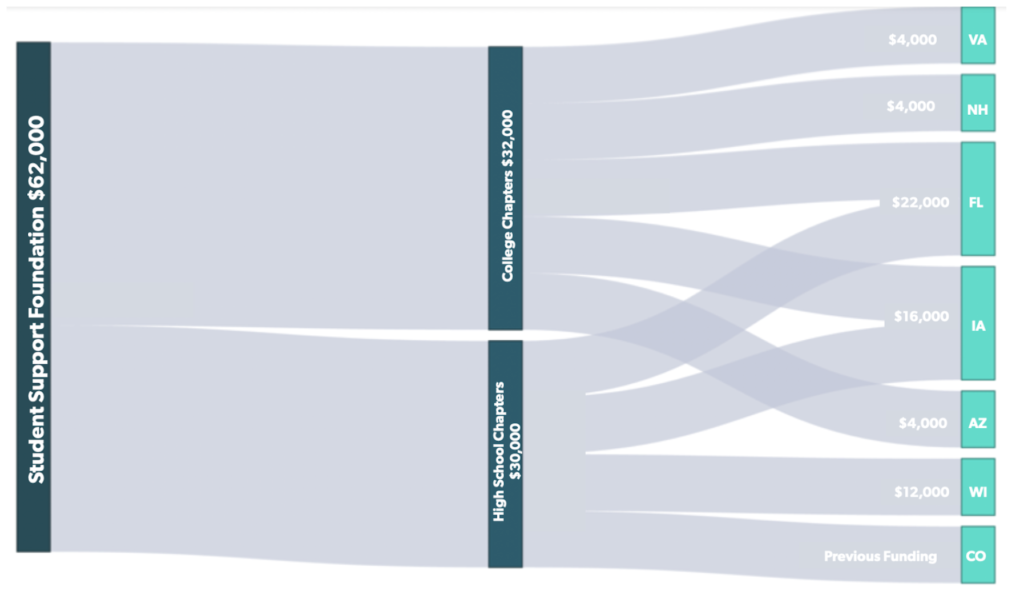
With all of the new visualization tools available to research professionals, we took the opportunity to try something new. Enter the Sankey Diagram. The figure pictured below was created to show how the Student Support Foundation operates at the high school and college level across multiple states. After learning how to make a Sankey Diagram, it turned out beautifully but was ultimately cut due to space. It was Sir Arthur Quiller-Couch who first said, and Willam Faulkner who famously repeated his advice, that you must “murder your darlings.” You can tell the story of the Student Support Foundation through a few key sentences. Sometimes a figure isn’t the best way to tell the story. Luckily, we’ll find other opportunities to use the skills we learned for coding a Sankey Diagram.
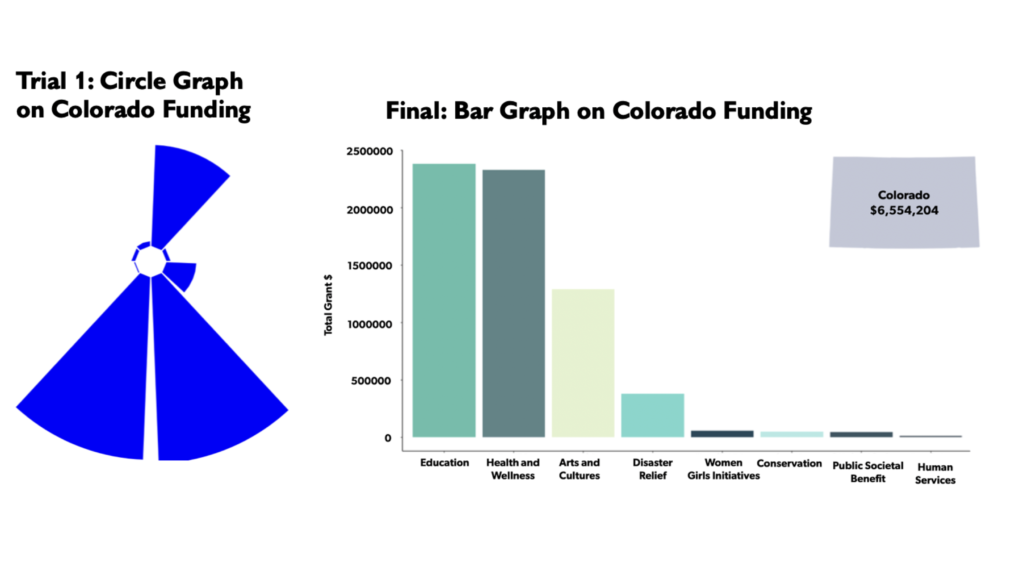
While looking through new visualizations, we thought, “What if we could spice up the bar graph?” Nothing against bar graphs, but they’re not exactly unique. We found circle graphs as an exciting alternative. We started with applying the circle graph to grants per sector in our own backyard of Colorado (Trial 1). As you can see, it is extremely hard to read due to the same range issues we experienced in lesson 1. Plus, the shape makes it more of an art piece than a way to understand giving. So for this data, we went back to the tried and true bar graph.
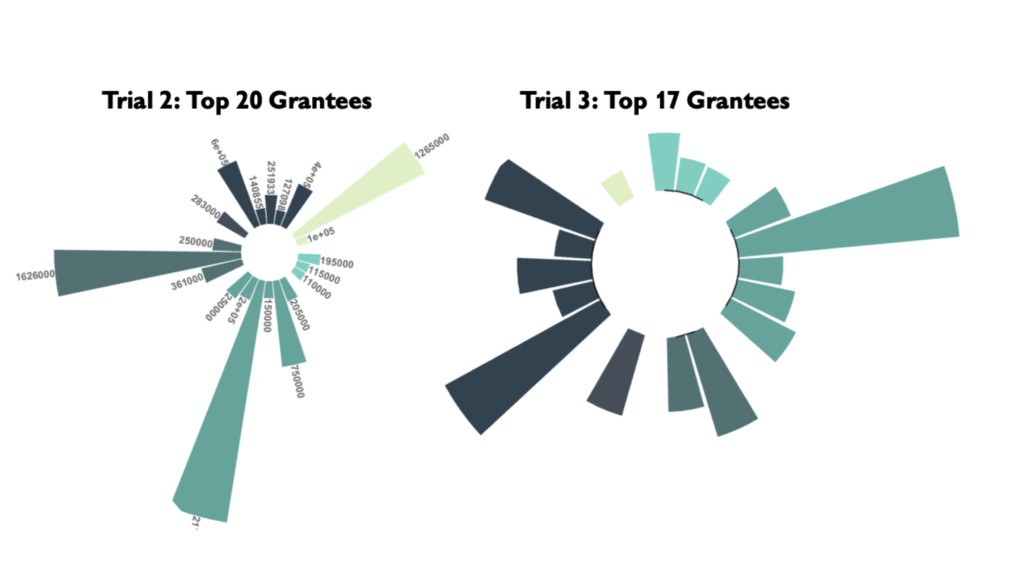
It is clear that the circle graph didn’t work for our Colorado giving data, but that doesn’t mean we never will try it again. We knew from Trial 1 that the circle visualization would work best on data that had a small range. So Trial 2 of the circle graph was tested on our top 20 grantees to show MFF’s largest grants of 2021. However, we had grantees sectors who received over 1 million dollars which pulled the proportion of the circle, and made the remaining sectors so small you couldn’t see them. But, we were not deterred.
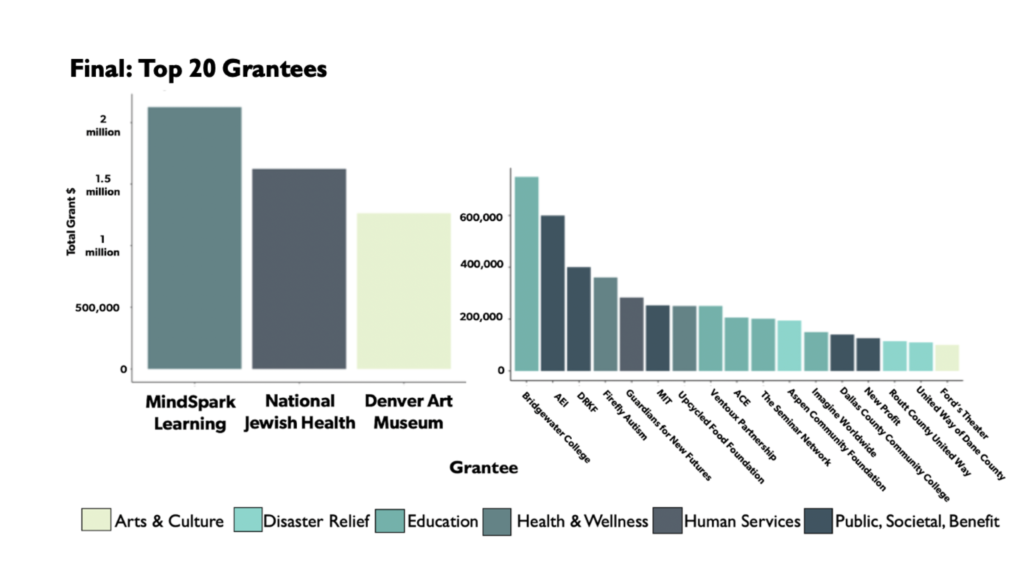
We moved the $1 million+ grantees to their own graph, and made a top 17 grantee circle graph. Finally, we had a circle graph that looked beautiful and was relatively easy to read. However, was this figure worth the paragraphs it would take to explain it? Why would we not make a singular bar graph figure that shows our top 20 all together, in the same format? The circle graph was hiding our message of highlighting our top 20 grantees. So you won’t see a circle graph in the 2021 Disruption Report, but there’s always 2022!
Data visualization is a creative process that takes practice, practice and more practice. It is about telling the clearest story you can. It comes down to trial and error and a never ending drive to try something new. You never know what will be the best fit and no matter what figure ends up in the final document, the learning along the way is priceless.